
A broker offered you a lane last week at a number that would have been fantasy in 2024. You took it. It felt like the market finally turned.
It did. But the useful question isn’t whether rates are up. It’s how long the thing that made them go up is going to last — and there’s a number that answers it.
What’s actually happening
Two things, and they’re moving at different speeds.
FTR’s forecast, reported by Truck News, has spot rates up roughly 35% to 40% this year depending on segment — and describes them as “basically at their peak,” not falling much through next year, but not climbing much either.
Contract rates are up about 10% to 11%, and are expected to keep climbing until roughly the middle of next year before levelling off.
Capacity utilisation is around 99%.
Read those together and the picture is specific: spot has already made its move. Contract has not finished making its. The gap between them is at its widest right about now, and the only direction it goes from here is closed.
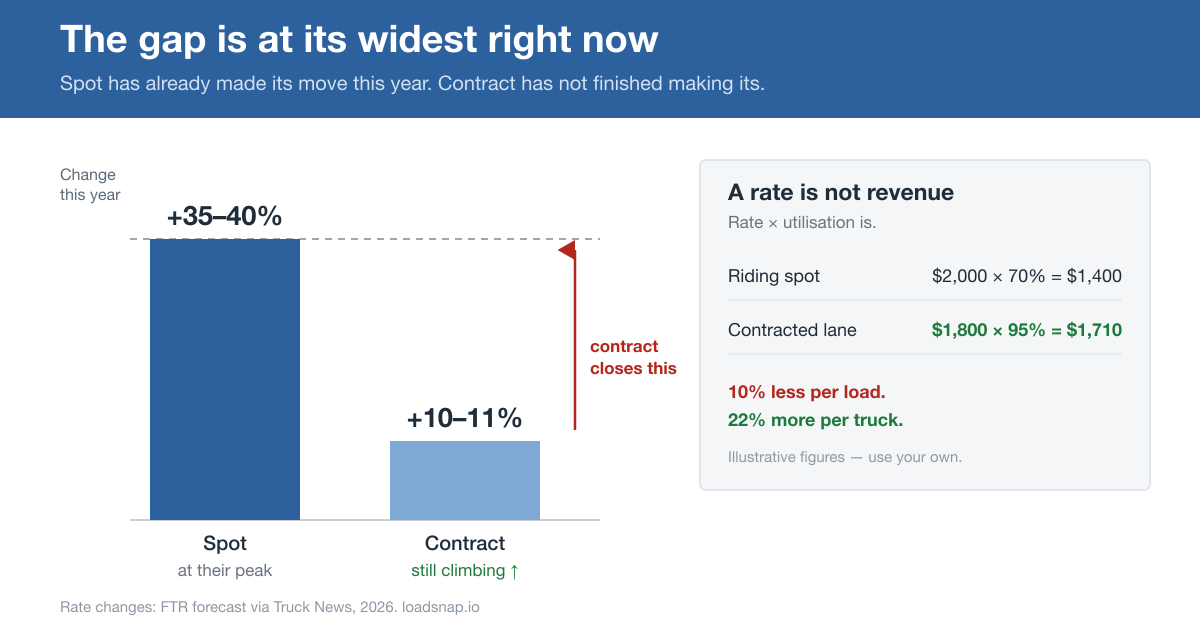
That’s the window. Not a prediction about rates — an observation about which of the two numbers still has room to run.
Why this cycle has a floor under it
Most rate spikes come from a demand surge, and demand surges end. This one is different in a way worth understanding, because it changes how long you can plan for.
Capacity tightened because trucks left, not because freight arrived. Part of that is ordinary carrier attrition after a long freight recession. Part of it is regulatory: the Department of Transportation announced on August 9 that more than 26,000 commercial drivers have been placed out of service for failing English Language Proficiency checks, and FMCSA is now proposing to make that enforcement permanent rather than leaving it as policy.
You can have your own view on the rule. The operational point is neutral: capacity removed by regulation doesn’t come back when rates rise. A demand-driven spike invites new trucks in and self-corrects. This one has a floor that a good quarter can’t lift.
So the tightness is more durable than a normal spike. And the spread is still going to close, because contract catches up. Both things are true, and they point at the same action.
The number that isn’t the rate
Here’s where most small carriers get this wrong, and it’s the same mistake as pricing a lane instead of a round trip.
A rate is not revenue. Rate × utilisation is revenue.
Spot pays more per load and pays nothing on the days you don’t have one. Contract pays less per load and pays it on every load in the commitment. Compare them per load and spot always wins. Compare them per truck-week and it often doesn’t.
Illustrative — use your own numbers, the ratio is the lesson:
| Rate per load | Utilisation | Effective per load | |
|---|---|---|---|
| Riding spot | $2,000 | 70% | $1,400 |
| Contracted lane | $1,800 | 95% | $1,710 |
The contract pays 10% less per load and 22% more per truck. And that’s before you count the hours your dispatcher spends re-covering the truck every time a spot load falls through.
The trap is that spot’s number is the one you see on the board every morning, and utilisation is the one nobody prints anywhere.
Six things to check this week
- Your actual utilisation, last 90 days. Loaded days divided by available days. Not your impression of it — the number.
- Which lanes you’ve run three or more times this quarter. Those are the ones a shipper might commit to, because you’ve already proven you cover them.
- What your spot rate on those lanes was 12 months ago. If it’s up 35%, you’re holding the peak, not the trend.
- Whether any current customer has an RFP window opening. Contract season conversations start well before the freight moves.
- Your empty days by day-of-week. Most carriers find a pattern they didn’t know they had, and a contracted lane can be chosen to fill exactly it.
- Whether you’d survive spot at last year’s levels. If not, that’s the whole argument for locking something in while you have leverage.
The conversation, two ways
What most carriers say when a broker mentions committed volume:
Thanks — I’m doing better on spot right now, so I’ll pass.
True today. It reads to the broker as “not interested in a relationship,” and they stop asking.
What keeps the option open:
I’d look at committed volume on Toronto–Chicago. I’ve run it 6 times this quarter, 100% on-time, dry van. At $1,800 all-in with 4 loads a week I’d commit a truck to it. Happy to start with 30 days and review.
Same carrier, same truck. One ends the conversation, one starts a negotiation — and does it while you’re negotiating from the strongest position you’ve had since 2022.
Notice it’s not longer. It’s just specific: the lane, the history, the number, the volume, the term.
Do this today
Work out your loaded-days percentage for the last 90 days. One number, ten minutes with your rate confirmations.
If it’s under about 85%, your problem isn’t the rate — it’s the gaps, and a contracted lane at slightly under spot is very likely worth more to you than the spot rate you’re protecting.
If it’s above 90%, you’re running well and the play is different: use the leverage to raise your spot floor while the spread is still wide, and stop taking the cheap loads you accepted in 2024.
Where the friction actually is
Both paths need the same thing: more conversations with brokers you don’t currently work with, in lanes you want to be in.
That’s the part that doesn’t scale by trying harder. Every enquiry means retyping the load number, origin, destination, equipment, MC, insurance, callback number — a couple of minutes each, forty times a morning.
LoadSnap sits on top of LoadLink, DAT and Truckstop and sends your templated enquiry with the load’s details already filled in, one click, from the board. It doesn’t forecast rates and it won’t tell you which lane to commit to. It removes the retyping between deciding to go after a lane and actually being in the running for it — which is the constraint when your window is measured in months.
Related: Brokers don’t pick the best carrier — they pick the first credible one, and why round-trip economics beat per-lane rates.
Rate figures are FTR forecasts as reported by Truck News; the out-of-service figure is from the U.S. Department of Transportation, announced August 9, 2026. Written September 2026 — market conditions change, so check current data before making a commitment.